Script Studio: Run History and Diagnostics
Every execution of every script is recorded, whatever caused it to run. The run history is where an administrator establishes what took place, when, and why an execution failed. Jira provides no equivalent record for its own configuration, so this is one of the capabilities Script Studio adds.
Note: 📹 Video placeholder — investigating a failure: identifying the affected script in the file tree, narrowing the time period, grouping the failures, and reading the output of the failing execution.
1. Opening the run history
- The history option in the Properties panel toolbar, which opens the complete history.
- The Recent runs row in the Properties panel, which opens the history for the selected script.
- The Last run row, which opens that execution directly.
- The Run History command.
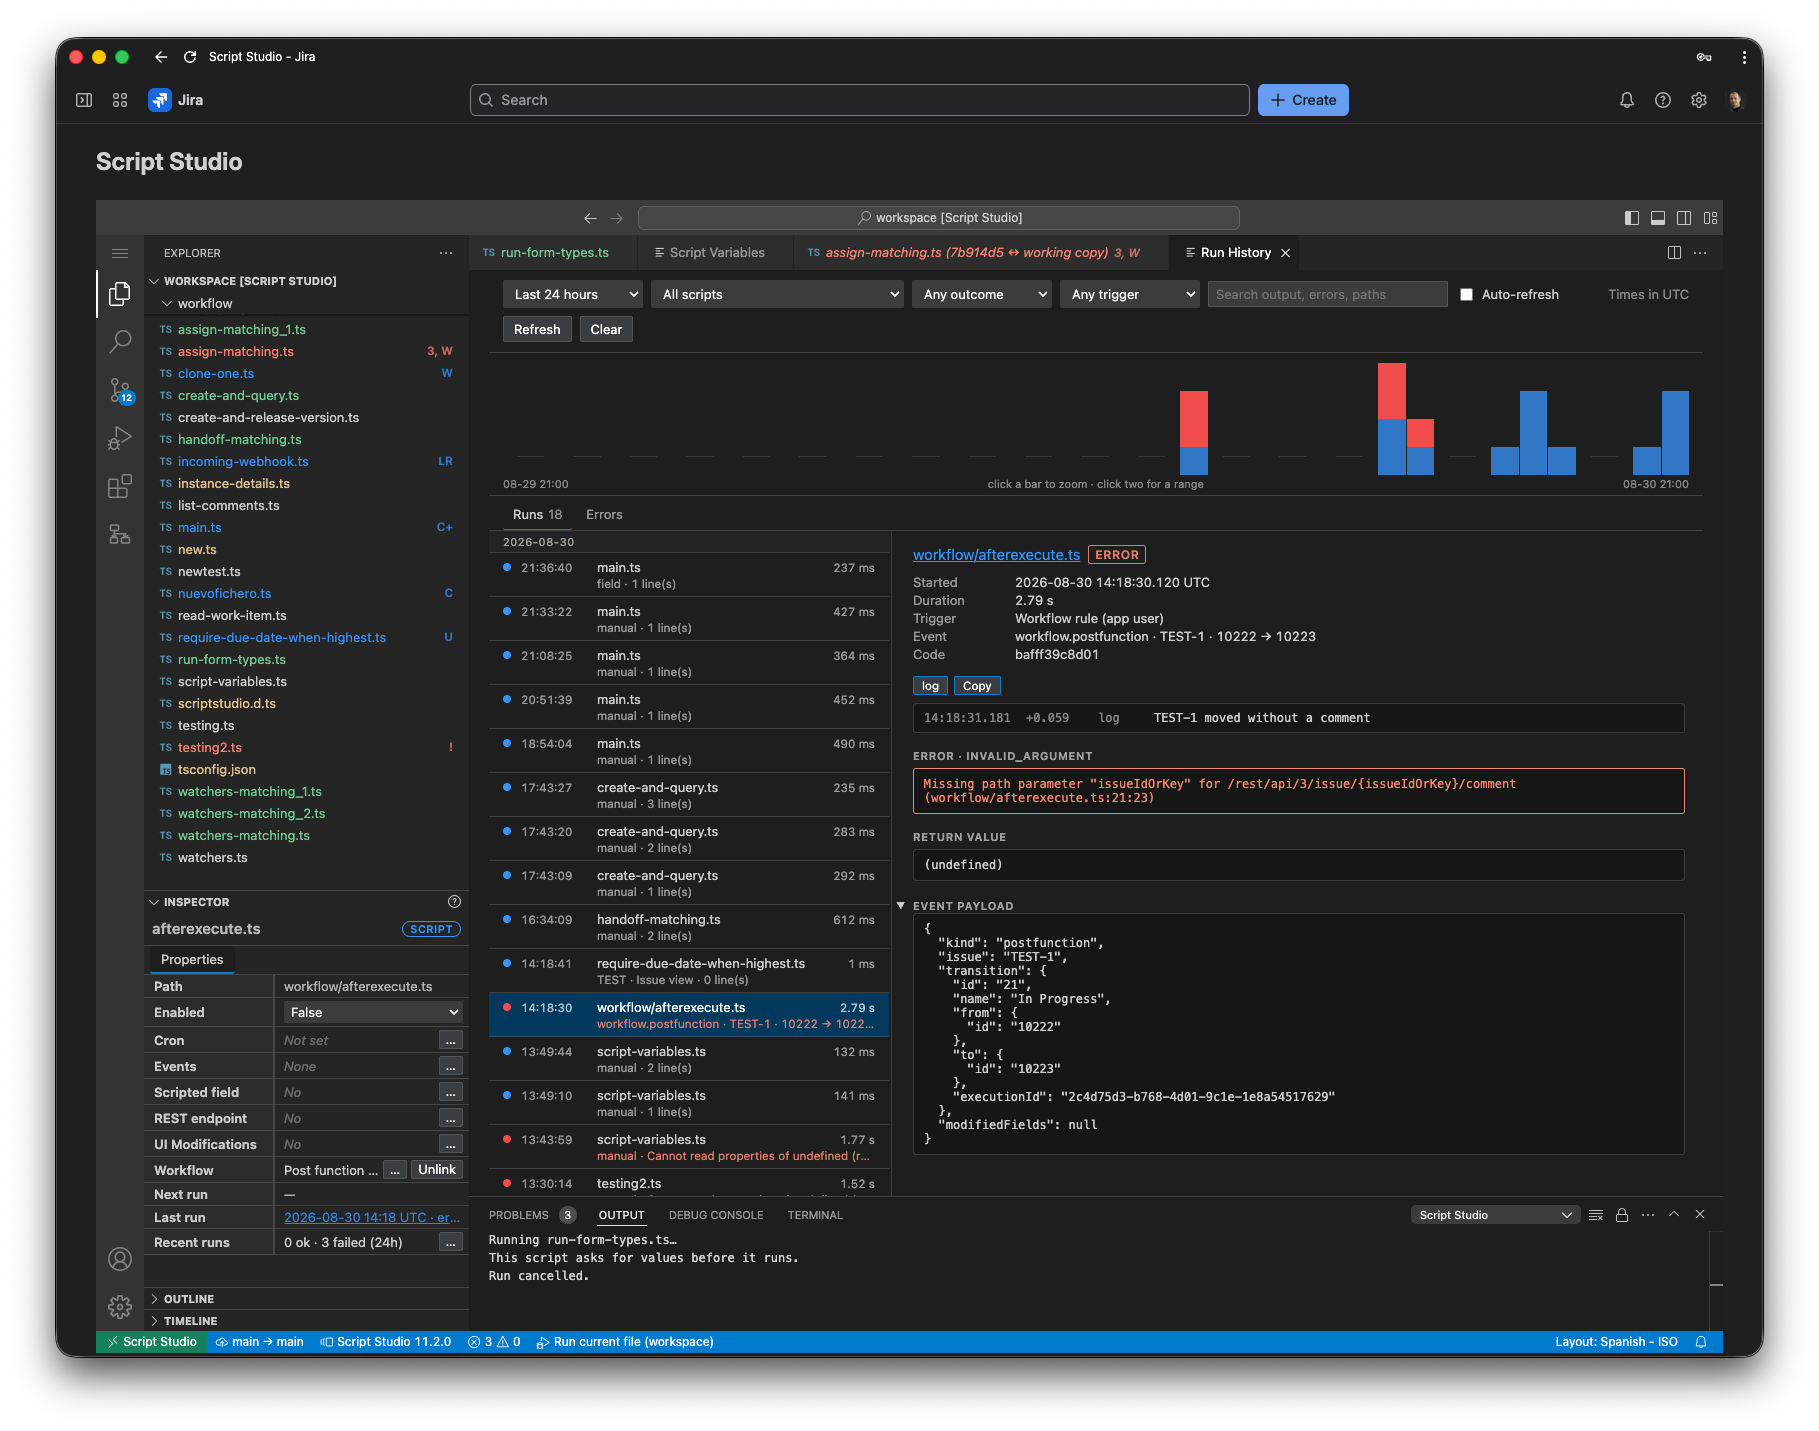
2. Filters
| Filter | Purpose |
|---|---|
| Time period | The last 15 minutes, hour, 24 hours, 7 days or 30 days, or a specific period. |
| Script | Restricts the list to a single script. |
| Outcome | Successful, failed, or timed out. |
| Started by | Manually, by a schedule, by an event, by a field calculation, by a REST call, by a workflow rule, or by a UI modification. |
| Search | Searches the output produced by the scripts as well as error messages, so that an execution can be located by something it recorded. |
| Automatic refresh | Updates the list periodically while it is open. |
Note: All times are shown in UTC, so that they correspond directly to the times shown when configuring a schedule.
3. The activity chart
A chart above the list shows the number of executions over the selected period. This makes an unusual pattern — a group of failures overnight, or a script running far more often than expected — apparent before the individual entries are examined.
4. Executions
Each entry shows the script, what started it, the outcome, the start time and the duration. Selecting an entry displays:
- Details of the execution: script, cause, outcome, start time, duration and reference.
- Ran as, for a manual run: the administrator's name, alongside their account identifier.
- The subject, where applicable: the issue, project or sprint concerned.
- The output produced by the script, with the time of each line and the elapsed time since the execution began. Lines can be filtered by type.
- The value returned by the script.
- The error, where the execution failed.
5. Grouped failures
The Errors tab presents the same period grouped by error rather than in chronological order. Each group shows how often the error occurred, which scripts were affected, and when it last occurred. Selecting a group returns to the list of executions, filtered to that error.
On an instance with a substantial number of scripts, this is normally the quickest way to establish what requires attention.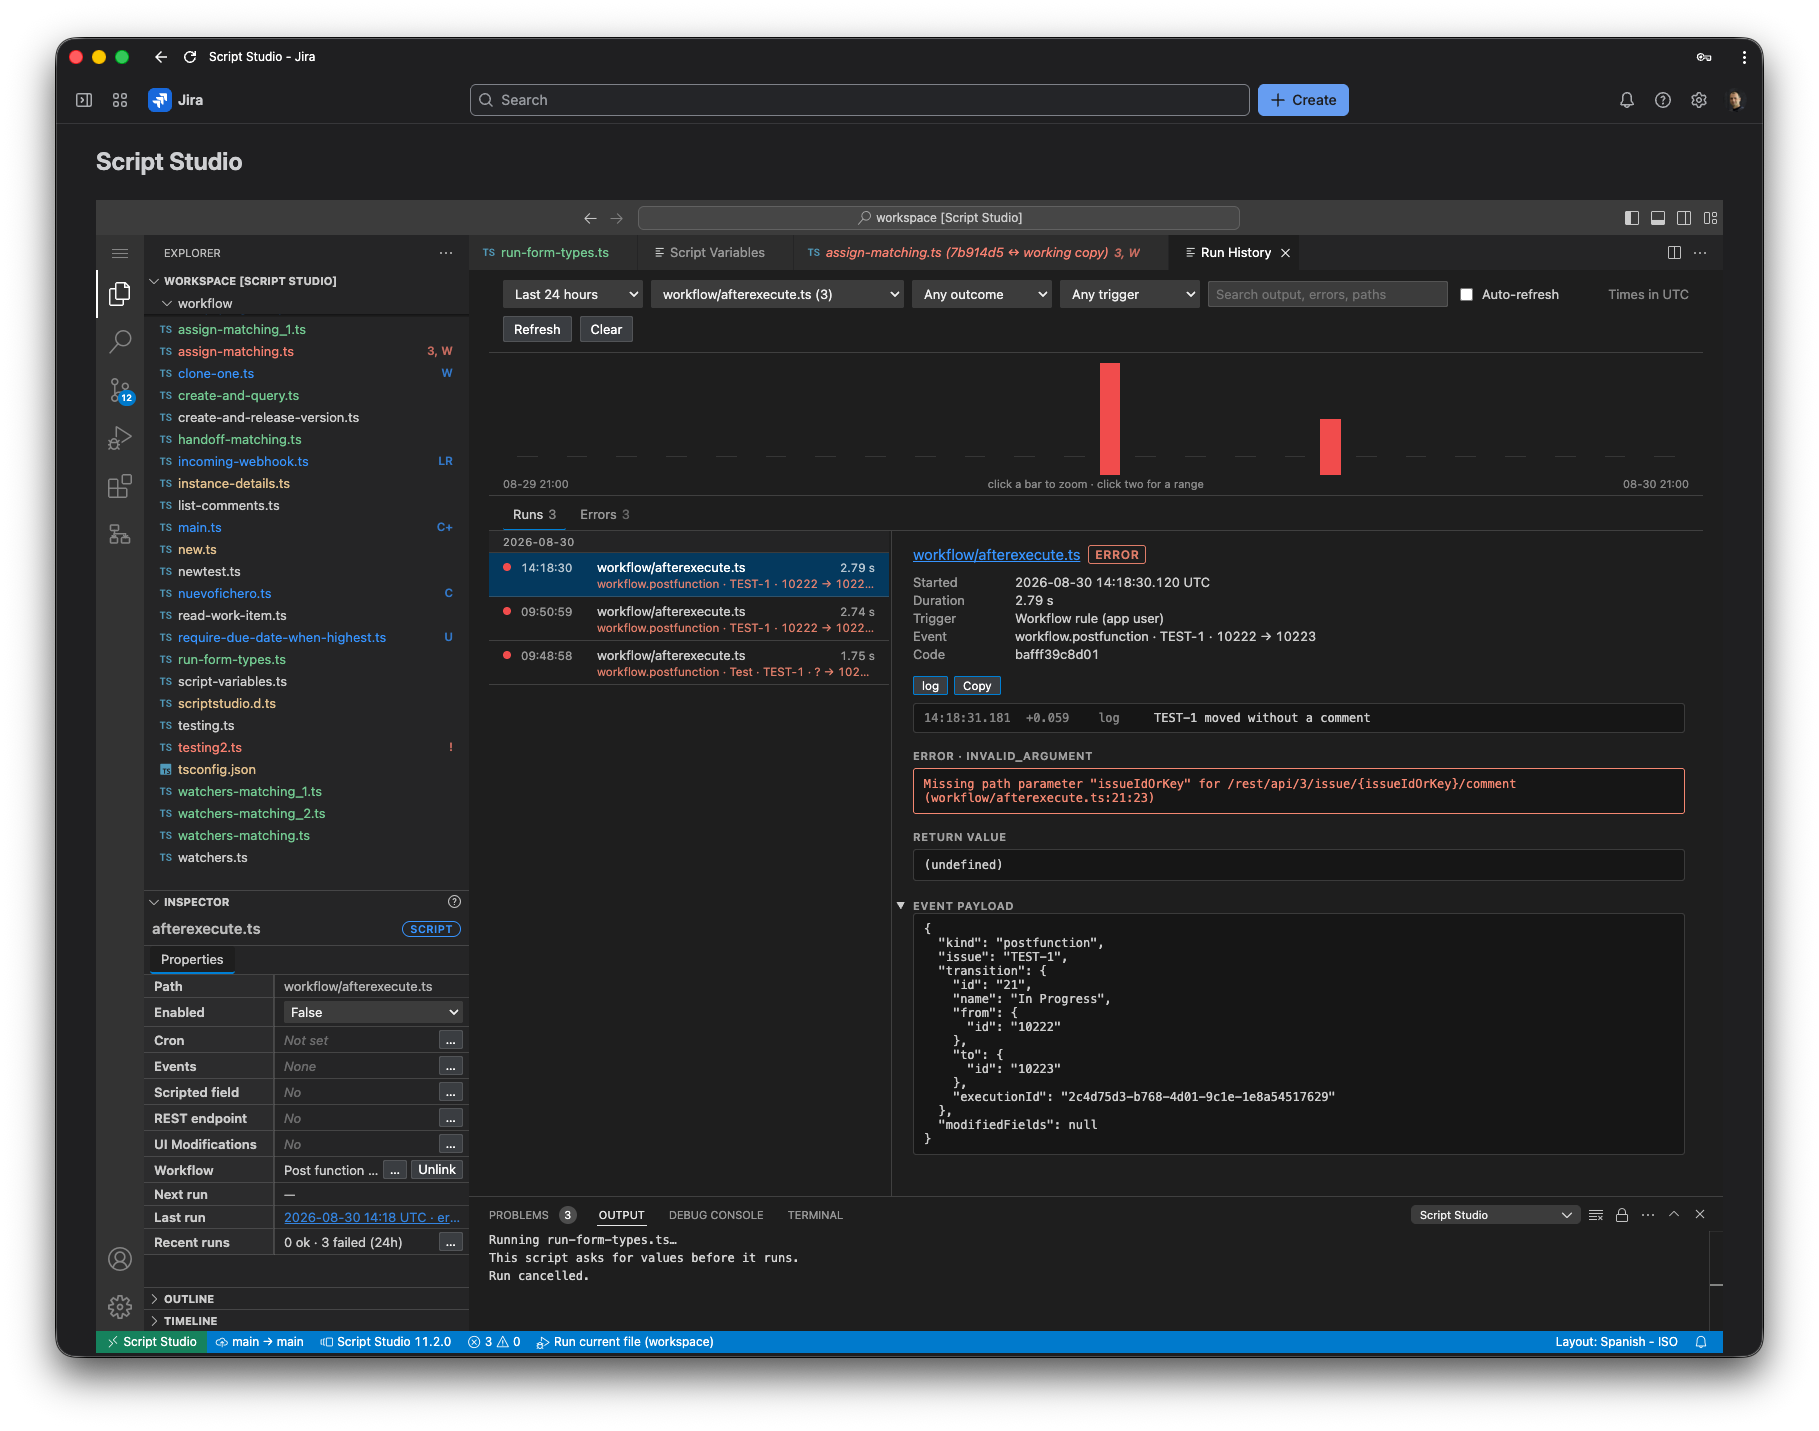
6. What is recorded
Manual, scheduled, event-driven, REST and workflow executions are always recorded.
Field calculations and UI modifications are recorded selectively. Both can run far more often than a person would want an entry for — a field is calculated on every issue view, and a UI modification runs whenever the relevant form opens or a watched field changes — so by default only failures, slow executions and executions that produced output are retained. Each has its own Record every run setting, which can be enabled temporarily while investigating a problem.
7. Retention
| Records are retained for | Value |
|---|---|
| Age | 30 days |
| Executions per script | The 200 most recent |
| Executions in total | 5,000 |
Older records are removed automatically. The history can also be cleared manually.
8. Indicators in the file tree
A script whose most recent execution failed is highlighted in the file tree, so that a failure is apparent as soon as the workspace is opened, without the history being consulted. See The Editor and the Workspace.